
Table of Contents
Key takeaways
- Finance teams have had a busy quarter - number of reforecasts conducted on average has seen a large jump (63%)
- Revenue forecasts have taken a hit, and sentiment is deteriorating in the face of economic uncertainty
- Despite this, most finance teams remain confident in the direction of their companies
- AI maturity is increasing, and as it does finance teams are deriving a different set of benefits from it - and data quality has emerged as the biggest barrier
- Planned AI investment is again on the rise, but ‘advanced’ firms are planning a larger increase than their more advanced ‘leading’ peers - a sign we may be approaching peak AI spend?


Executive summary
The data for the second edition of the CFO Index is in and a strange picture is emerging.
There are some signs that finance teams are preparing for a storm: average realised growth is down QoQ, market uncertainty sentiment has seen a dramatic rise, and the number of forecasts performed has jumped a staggering 63%.
But despite these signs of stress, finance teams seem, to a degree, unfazed.
Growth forecasts are largely unchanged, financial AI investment is growing further, and not only do finance teams report high confidence - they also predominantly view recent turbulence as an opportunity, rather than a liability.
Let’s get into the details - but first, explore the headline findings for yourself.
Preparing for a storm
The most striking finding in the Q2 data is the dramatic increase in forecasts performed: perhaps unsurprisingly given the news over the past 3 months, finance teams have been busy. The average number of reforecasts performed jumped from 9.6 in Q1 -> 15.8 in Q2 - they’re really rolling in.
Uncertainty sentiment is increasing, with 36.5% of respondents saying their uncertainty over future sales growth is ‘higher’ than it was 6 months ago (+5% on Q1 figures) and 12% saying ‘much higher’ (+2%). There’s a clear feeling of unease here.
And that won’t be helped by a shrink in reported revenue growth in the past 12 months, which is down overall (although only a modest 0.6%).
We also asked respondents to rate the impact of various different drivers of market uncertainty.
Ranked by the share reporting a major impact, external drivers dominate: geopolitical conflict and regional instability (32.2%) and macroeconomic conditions (32.1%) lead, followed by energy and input cost volatility (30.5%), pace of technological change (29.1%) and supply chain disruption (28.3%).
The internal drivers - data quality (25.4%), regulatory change (25.0%), talent (22.4%) and internal alignment (21.0%) - trail but aren’t negligible: every one of the ten drivers is rated moderate-or-major by at least 59% of respondents.
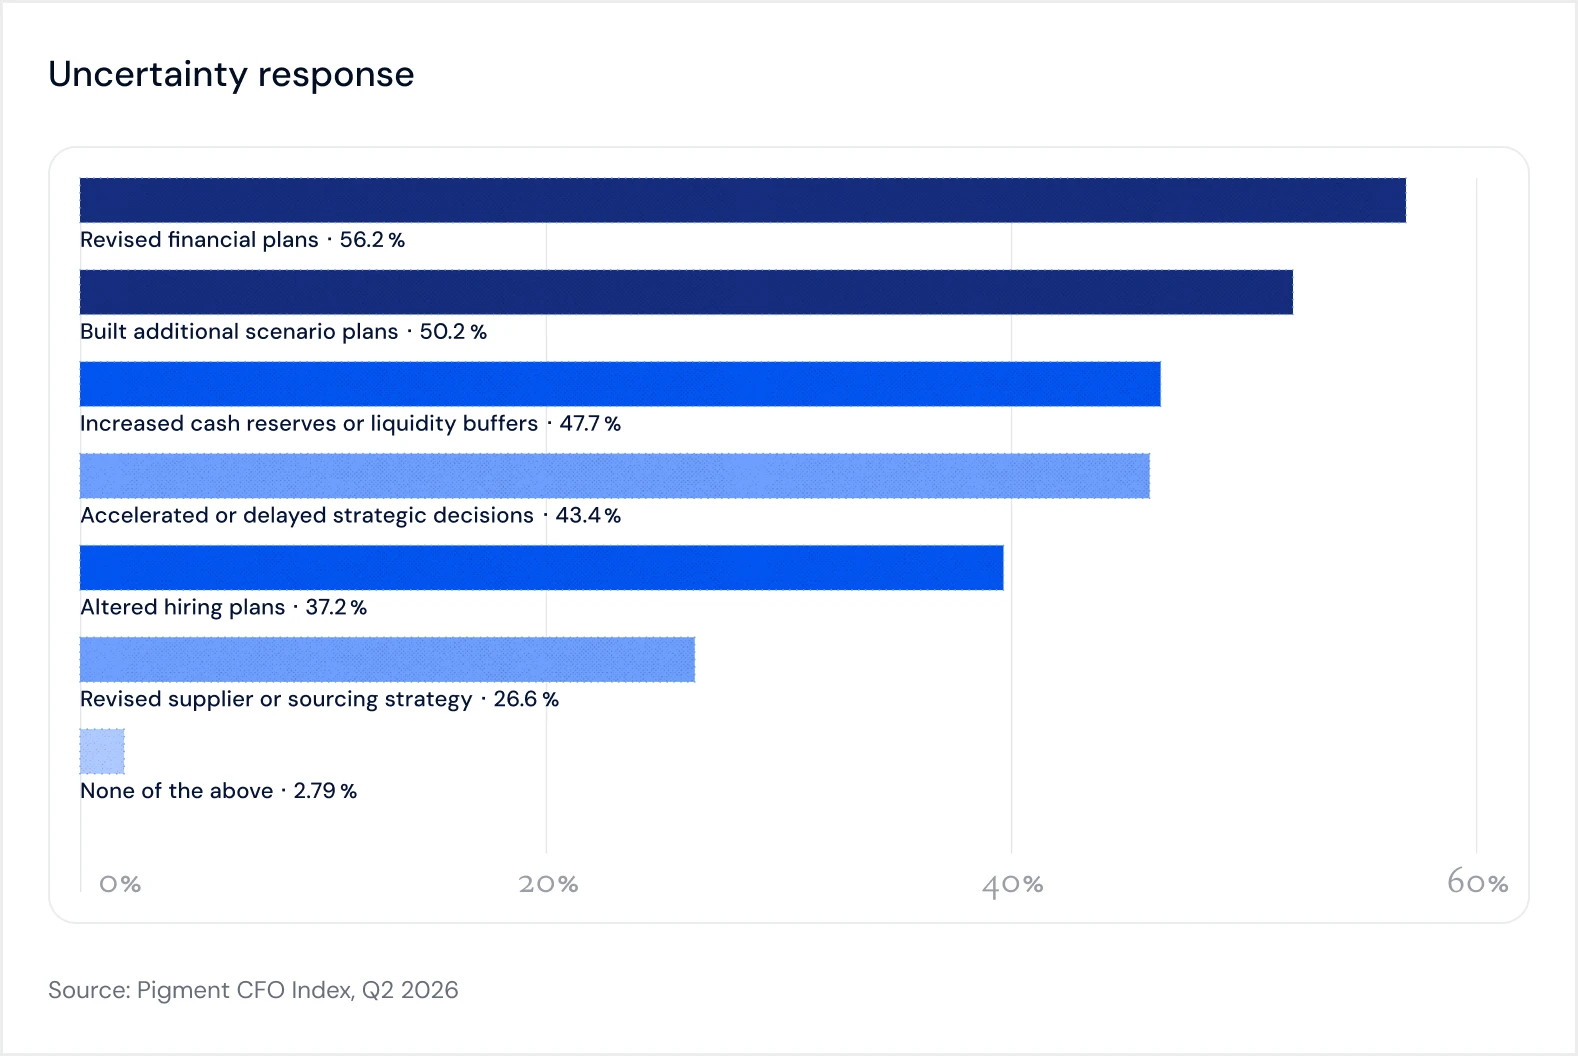
So what are finance teams doing in response? Quite a lot - around 50% have revised financial plans, built additional scenario plans, and increased cash reserves/liquidity buffers. FP&A are staying ready.
Planning horizons
Another interesting trend that emerged from the data, with a new question for Q2, was that most (54%) finance teams’ planning horizons do not extend beyond 6 months ahead.
Just 6.2% maintain a long-range plan for 5+ years, although that climbs to 10.1% at enterprise. This does make sense intuitively - in times of economic uncertainty it’s harder to make long-term plans.
Optimism persists
Despite the trepidation we’ve seen already, growth forecasts for the year ahead have barely moved (11.6%->11.5%). And forecast uncertainty has remained steady.
When asked how confident they are about the direction of their company, the results are encouraging:

When asked whether they’ve seen the turbulence of the past 3 months as a liability or an opportunity, a surprising majority see it as an opportunity.
Perhaps these figures might shift when the economic consequences of the closure of the Strait of Hormuz kick into action - we’ll be keeping close watch on this in the Q3 data.

Both these measures of confidence scale with AI maturity. Early stage AI organizations report 23% ‘very confident’, rising to 34% at developing, 43% at advanced, and a whopping 75% at leading. A similar pattern unfolds for the opportunity/liability question.
So why the confidence?
AI in finance is evolving
It’s hard to be sure exactly where the confidence comes from, but there is an interesting picture emerging around AI that might explain part of it.
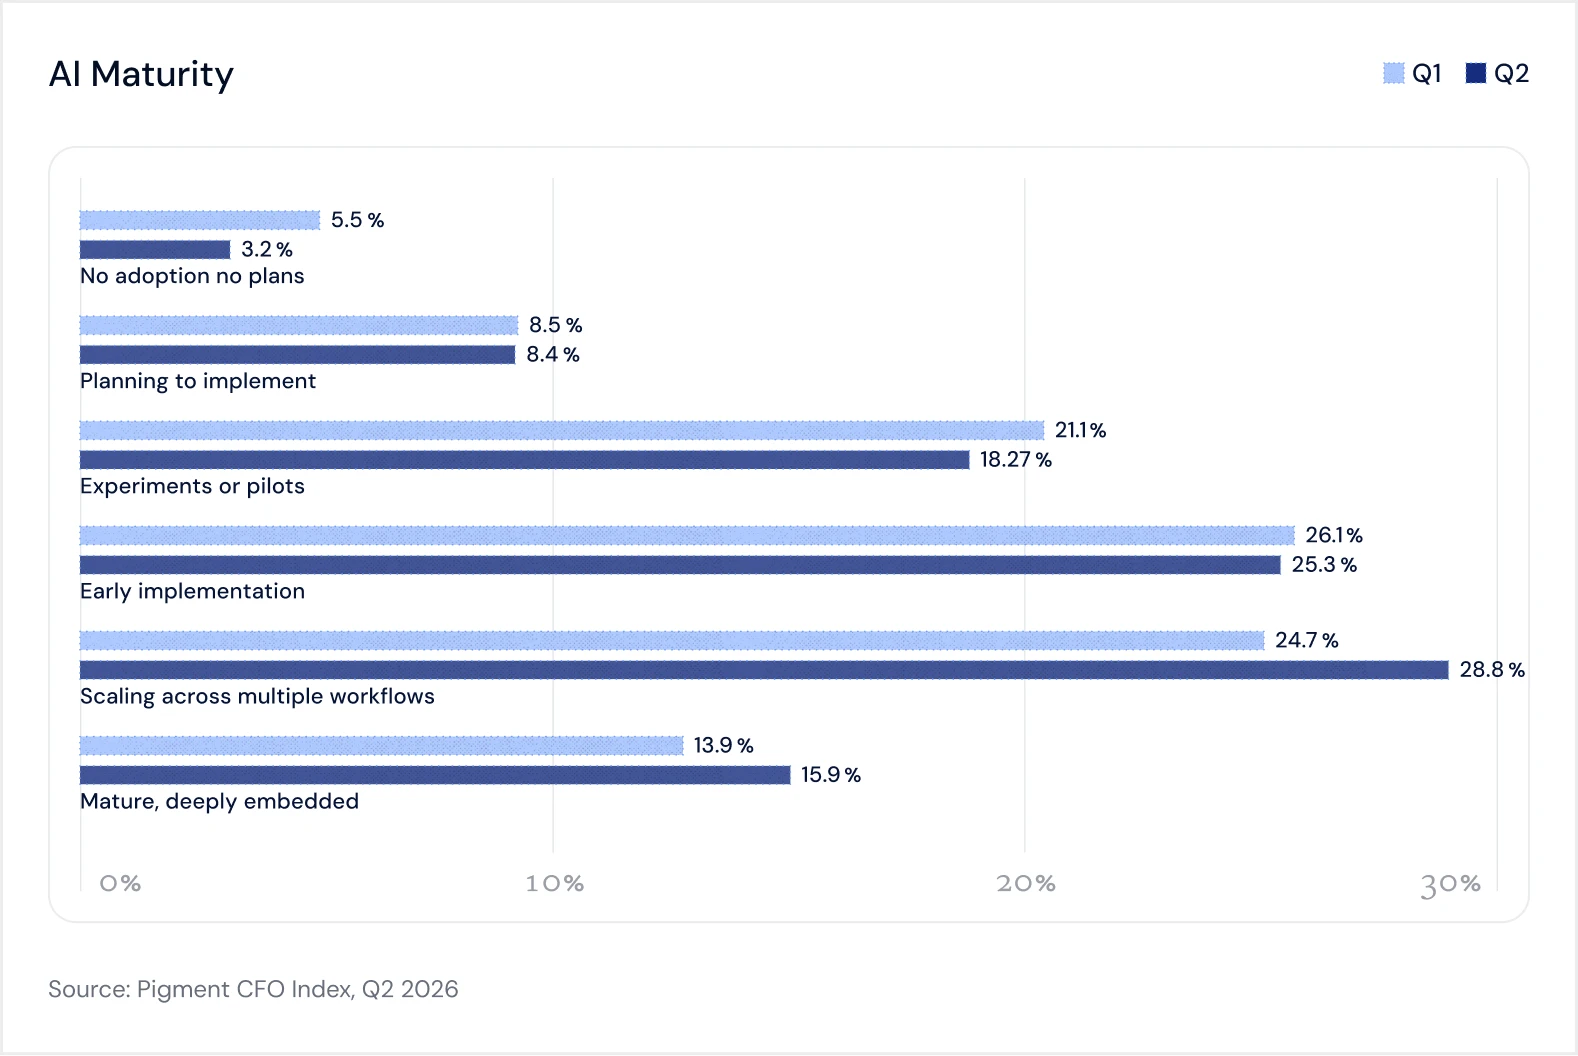
Comparing the Q1 data against Q2, we can see that AI maturity in general is on the rise, with the number of respondents identifying their finance department as being at the scaling or mature levels inching higher.
And when we look at the benefits that are being derived from it, we can see that those are also evolving.
As financial AI becomes more embedded in everyday processes, the perceived value is shifting away from more ‘operational’ benefits - reduced manual work, improved work experience, more time for strategic projects - and towards more impactful ones.
Perceived barriers are also shifting. Data quality has emerged as the single greatest issue - and that fact holds true across every crosstab.
Also of interest is that the perception gap with regards to AI we flagged in Q1 still exists, as pronounced as ever. A manager is nearly twice as likely (16.4%) to flag ‘poor quality outputs’ as a barrier for AI use than a VP or CFO (8.9%).
Is AI spend peaking?
Another interesting development between Q1 and Q2 is that leading firms are planning a smaller AI budget increase than advanced firms.
While leading AI firms are still increasing budgets, perhaps this is an early sign that we’re approaching the peak of AI spend and finance leaders will be looking for ways to prove ROI.
We’ll certainly be keeping a close eye on this data in Q3.
Market-level reports
United States
The US maintains the strongest revenue performance, the most acute market uncertainty, the most defensive balance-sheet behaviour and the fastest AI adoption, all at once.
It was the only market to upgrade its growth forecast this quarter (11.9%, +0.3), and although realised growth slowed 0.9 points it remains the highest of the four geographies at 9.6%.
Yet US respondents also report the sharpest business uncertainty sentiment: 18.0% say uncertainty is "much higher" than six months ago - nearly triple Britain's 6.5% and up from 15.2% in Q1 - and the US rates eight of the ten uncertainty drivers as more impactful than any other market, led by macro conditions (38.5% major impact vs 23.8% in the UK), supply chain (32.6%) and regulation (30.9%).
The response has been distinctly defensive-but-confident: US firms lead on building cash and liquidity buffers (54.7% vs 36.3% in France), on flexing hiring timing (42.4%) and on accelerating or delaying strategic decisions (48.1%) — and yet 51.4% are "very confident" in their organisation's direction, by far the highest of any market, and 31.6% view turbulence as primarily an opportunity.
On AI, the US leads on essentially every measure: half of US organisations are now at scaling or mature stage (50.6%), 32.4% increased AI usage significantly this quarter, 84.9% plan to increase spend, and the US out-adopts every other market on nearly every task-technology combination (e.g. machine learning for budgeting: 50.7% vs 27.2% in France).
Its AI value profile is the most advanced: leading on faster cycles (59.8%), accuracy (53.1%) and decision quality (56.0%) while citing "reduced manual work" the least (40.5%).
United Kingdom
The UK holds the highest growth forecast of the four markets (12.8%, unchanged) and was the only geography where realised growth accelerated (9.2%, +0.9).
Its uncertainty sentiment is by far the calmest - just 6.5% report "much higher" uncertainty, and nearly a quarter say uncertainty has fallen - and it rates virtually every uncertainty driver as the mildest of any market (macro: 23.8% major impact; talent: 16.0%; internal alignment: 15.6%; competition: 18.2%).
It plans furthest ahead: 26.2% maintain detailed plans beyond one year, the most of any geography, and only 17.5% plan just one quarter out, the least.
But firms were the most likely to reforecast (59.9%) and to revise supplier strategy in the past 3 months (30.1%), and the index records the highest forecast uncertainty band of any market (6.2%) - so that high expected growth also has the largest margin for error.
Confidence is mid-table: only 31.1% are very confident (second lowest) and just 15.1% see turbulence as primarily an opportunity.
On AI, the UK is a solid mid-table adopter: the highest "scaling" share (32.5%) but a modest mature share (12.5%), the strongest emphasis on productivity (64.0%) and reduced manual work (45.3%) as the value delivered and skills as its joint-top barrier (32.7%).
France
The outlook for France this year is gloomy. It reported the weakest realised growth (5.6%), and cut the growth forecast 0.8 points to 10.1%.
Only 3.3% of French respondents report much-higher market uncertainty (the lowest anywhere) and France was the only market where the index's forecast-uncertainty measure actually fell - yet just 14.4% are very confident in their organisation's direction, versus 51.4% in the US, and 29.2% are only "slightly confident".
France is the most concerned about geopolitics in the survey: 40.5% report major impact, the highest reading of any market on any external driver.
France also posted the largest jump in reforecasting frequency (+9.7 to 19.1, the highest count of any market).
On AI, France lags on essentially every measure, and the gap has widened in places. Only 5.2% of French organisations are at mature stage (down from 8.3% in Q1), and over half remain at pilot stage or earlier. Its value profile is a generation behind: "reduced manual work" is France's top-cited value (46.4%, the highest anywhere) while accuracy (28.5%) and faster cycles (37.4%) trail the field by 15–20 points.
In terms of AI barriers: cultural and organisational resistance is the highest of any market (26.8%), while data quality is the lowest (27.1%) - suggesting perhaps that French firms haven't yet pushed AI deep enough to hit the data wall.
But there’s evidence a catchup may be underway - France's planned AI investment increase jumped 16.2 points to 27.3%. That’s the largest swing anywhere in the entire index, taking France from last to first on planned spend increase.
Germany
Germany’s macro picture is the weakest. It has the lowest growth forecast of any market (9.2%, down a full point. Business uncertainty sentiment deteriorated sharply - 49.1% now report higher uncertainty, up from 38.4% - and Germany is the most short-termist planner anywhere (29.9% plan only one quarter ahead).
Yet German confidence is the second highest of any market (42.1% very confident). Perhaps that’s something to do with the fact that Germany is arguably the most AI-mature market in the survey.
It has the highest "mature" adoption share of any geography (21.4%, up from 13.7% and ahead of the US's 19.6%), and it leads all markets on agentic AI for the most sophisticated tasks — 41.8% use agentic AI for forecasting and 41.8% for scenario planning, the highest readings anywhere. Its AI value profile is correspondingly advanced on accuracy (44.9%).
Only 18.9% say AI improves their work experience, roughly half the rate of every other market, and the same was true in Q1.
Germany's barriers are high costs (47.4%, the highest anywhere) and slow procurement (29.1%, also the highest), with skills and resistance below average.
Its planned AI investment increase remains the smallest of the four markets (13.3%), consistent with cost sensitivity. And there is a sceptical tail worth watching: 10.8% of German firms decreased AI usage this quarter and 10.7% reported decreased AI confidence — both the highest readings of any market.
Methodology
All data was collected from 2,000 respondents between May 1 - June 2, 2026.
To calculate growth forecasts for the year ahead, we ask respondents to make a series of predictions about their future revenue: lowest, low, median, high, and highest. We then determine an ‘average’ prediction from those figures.
We then calculate revenue uncertainty figures by measuring the standard deviation away from their prediction.
Three pieces of advice
Address the data problem
Your data is almost certainly the number one barrier to your finance team deriving value from AI. And using AI effectively is now table stakes for performant teams. We published a write-up on how to improve your data strategy a few months ago, and it’s as relevant now as it was then.
Keep forecasting, but be smart
We can see in the figures that finance teams have been working harder than ever, in the wake of rising uncertainty. But working harder and smarter is much better than just working harder. Driver-based planning is one way to cut down on forecasting time, as is machine learning forecasting.
Build your scenario playbooks today
Market uncertainty is certainly on the rise, but we’re not in a crisis… yet. Now is exactly the time for forward-thinking teams to begin building their response playbooks. We published a guide on exactly how to do so.
What we’re looking for next
We’ll be back in Q3 for the next edition of the report, with more data on all of the above. But we’ll also be tweaking the survey to collect data on:
- How the market reacts to pricing model changes in the AI industry - will higher costs impact investment plans?
- The economic fallout of the continued war in Iran and the energy price shock associated with it
- Response to the three impending mega-IPOs: SpaceX, Anthropic, and OpenAI. Exploring the possibility of IPOing yourself? Read our guide, with advice from Pigment customers who’ve done it themselves - Figma, Chime, and Once Upon a Farm